We are excited to announce that Power Platform Monitor alerts are now generally available! Since entering public preview in August 2025, many organizations have created alert rules to stay on top of app, agent and flow health. Reliability is critical when alerts are used to detect and respond to issues in production. Today, Monitor alerts meet the reliability and maturity standards required for general availability, following sustained investments to improve quality and simplify onboarding.
What are Monitor Alerts?
Monitor alerts allow tenant and environment administrators to proactively monitor the operational health of their Power Platform resources and receive notifications when health metrics fall below thresholds they define. Instead of learning about problems from end users, admins can identify and address issues before they cause disruption. This reduces downtime and improves reliability across the organization.
What’s New with GA
Predefined alerts — protection with zero configuration
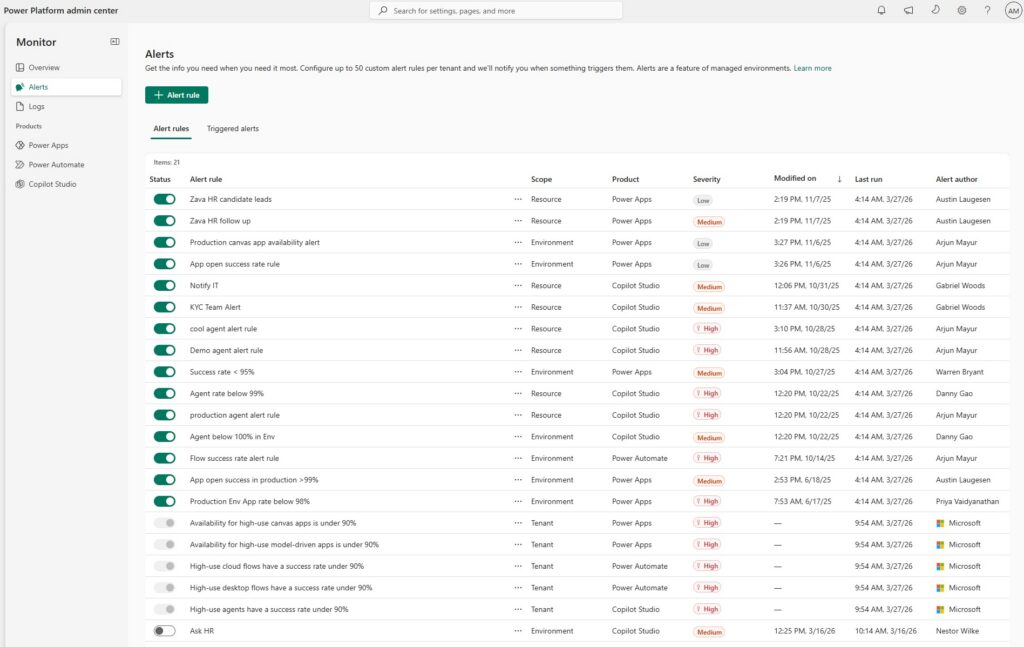
The biggest addition we’ve added is predefined alerts: a set of configured, Microsoft-authored alerts that are enabled by default for every tenant. These alerts automatically surface high-use canvas apps, model-driven apps, agents, desktop flows and cloud flows whose health has dropped below recommended baseline thresholds — with no setup required.
For example, predefined alerts will flag when:
- The availability of high-use canvas apps drops below 90%
- The availability of high-use model-driven apps drops below 90%
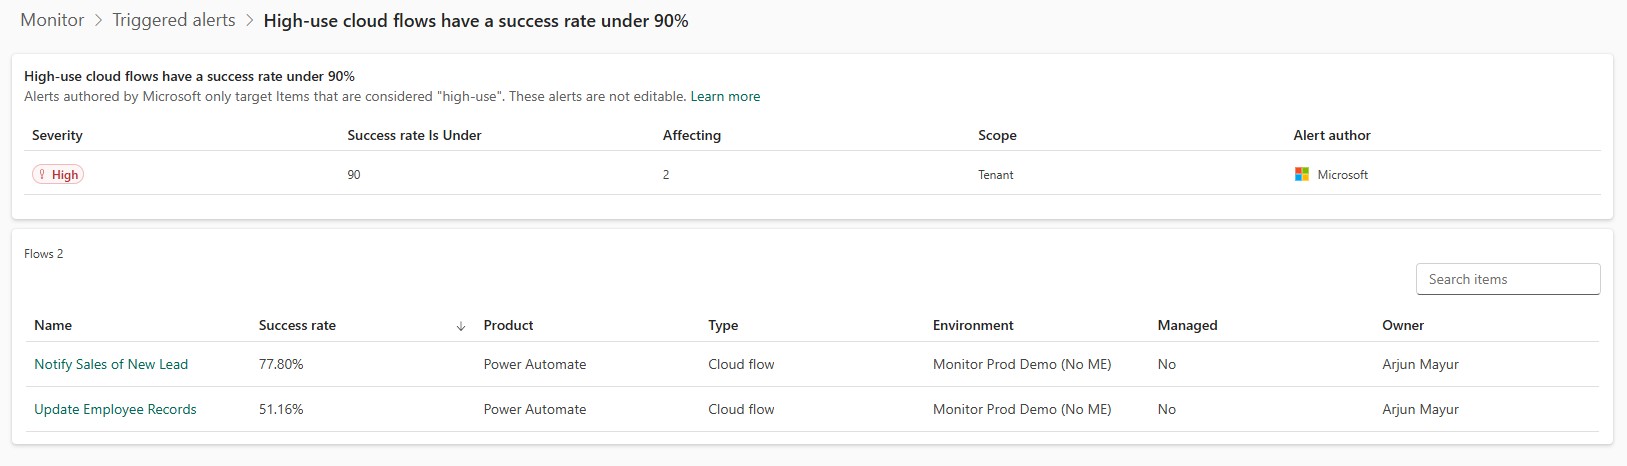
- High-use cloud flows are experiencing success rate degradation
Predefined alerts give admins an immediate signal on what matters most in their tenant, even before they’ve configured a single custom alert rule. Items can trigger these alerts regardless if they’re in a managed environment, and predefined alerts will encourage users to create their own alert rules to monitor these items against their own custom thresholds.
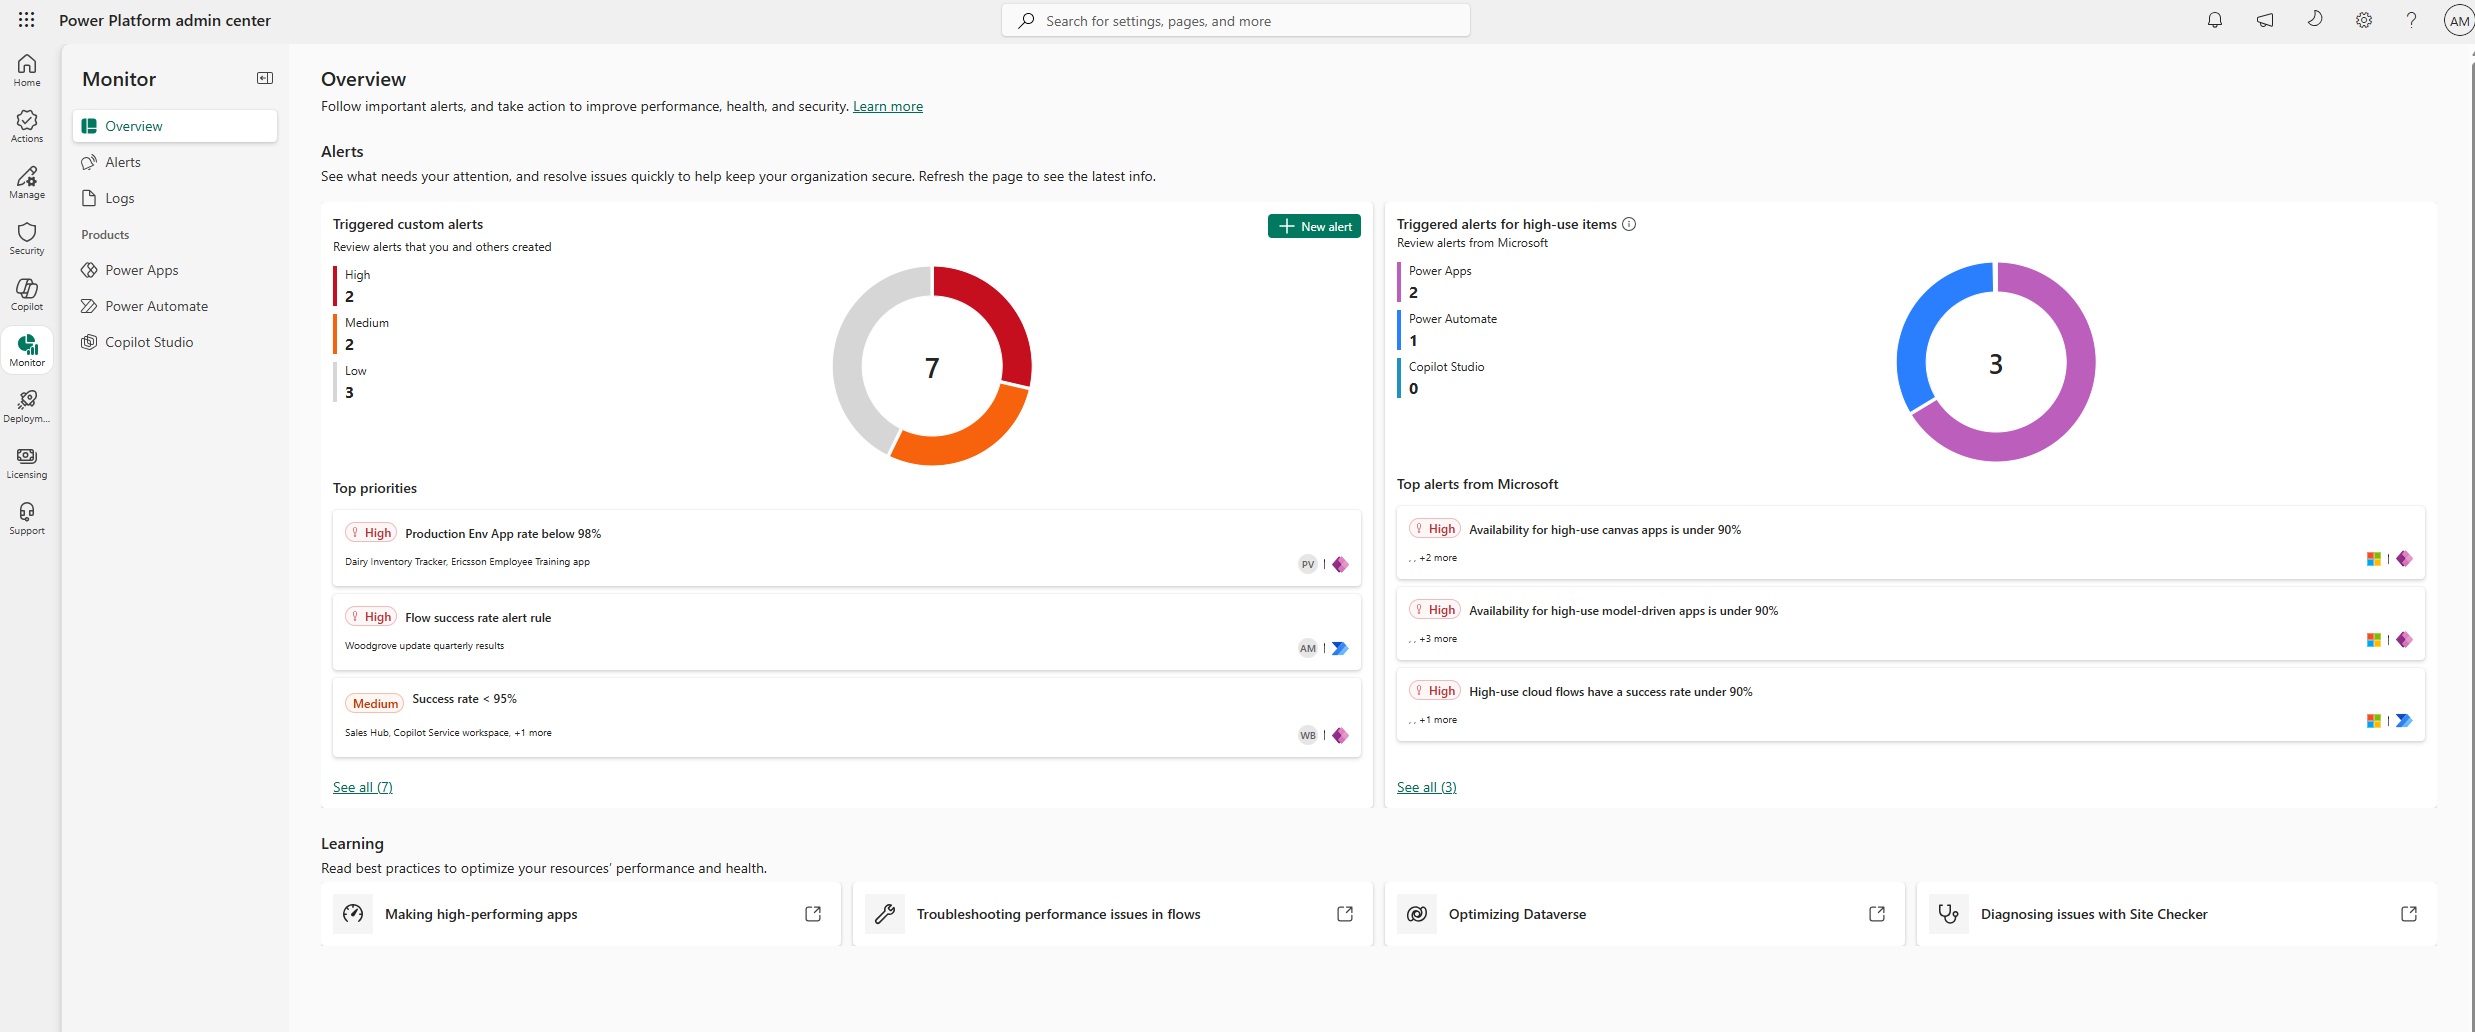
Redesigned Monitor overview page
We redesigned the Monitor overview page to be alerts-centric. When you land in Monitor, you now get an at-a-glance view of active alert conditions and resource health across your environments — making it faster to identify what needs attention and act on it.
Code app alerts
Custom alert rules now support alerting on your code apps in addition to canvas and model-driven apps. This gives admins deeper visibility into code app performance and the ability to catch performance degradation before it affects users’ day-to-day experience.
Work queue alerts (public preview)
Admins can now configure alerts for Power Automate work queues in Monitor, enabling proactive monitoring of work queue health alongside apps, flows and agents. This capability is launching in public preview alongside alerts GA.
How Monitor Alerts Work
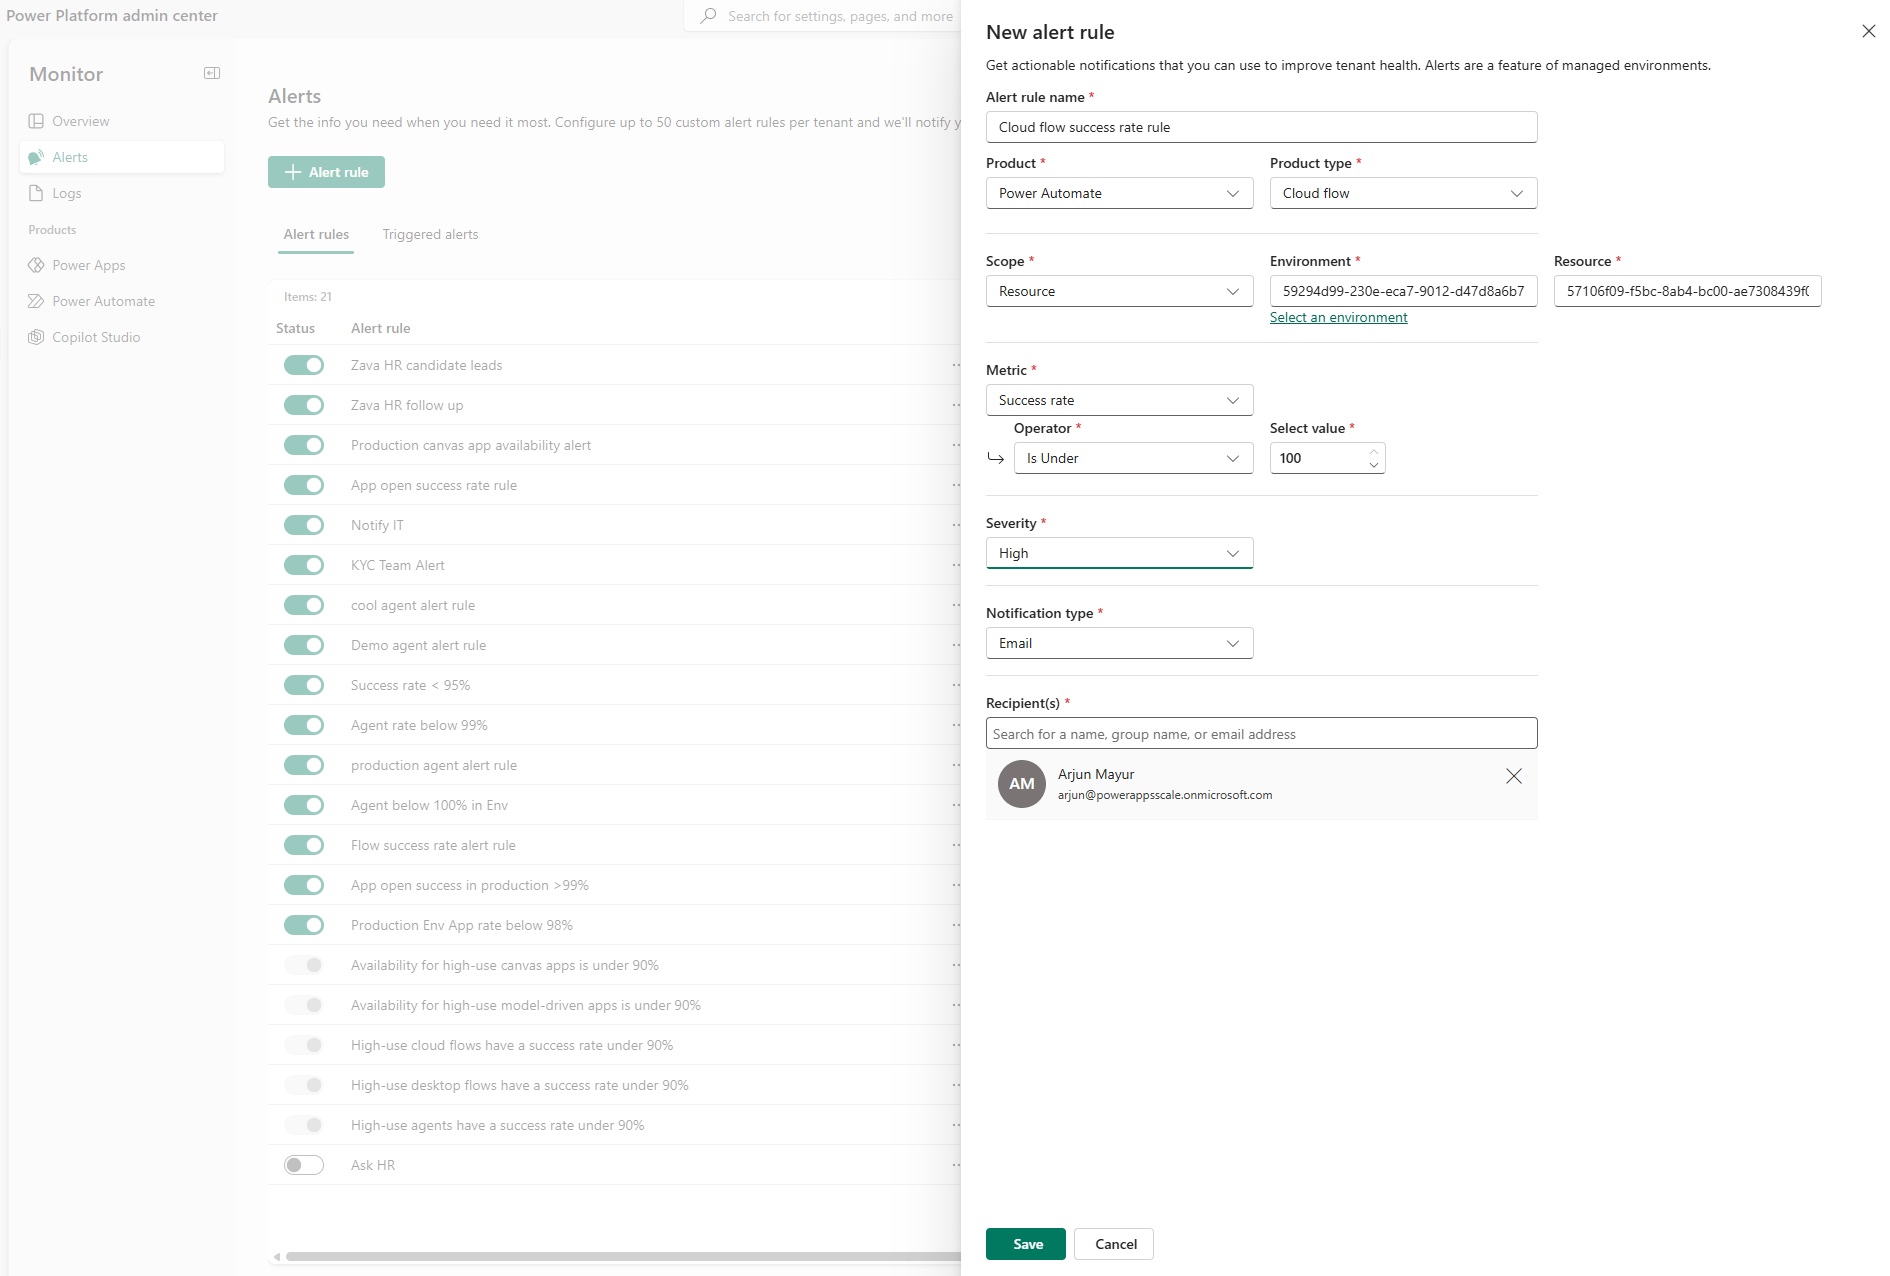
Admins define threshold-based rules on Monitor metrics. For example, this can look like receiving an alert when a cloud flow’s success rate drops below a custom threshold, or when a canvas app’s availability falls below an acceptable level.
Monitor alerts evaluate alert rules daily after aggregating new metric data for your environments. When a metric breaches a threshold, admins receive an email notification with a direct link to the details that triggered the alert.
You can scope alert rules to an environment or individual item, configure multiple recipients per rule (including security groups), and manage all active rules and review triggered alert history from the Alert Rules view in Monitor.
What’s Supported
| Product | Resource | |
| Power Apps | Code apps | |
| Power Apps | Canvas apps | |
| Power Apps | Model-driven apps | |
| Power Automate | Cloud flows | |
| Power Automate | Desktop flows | |
| Power Automate | Work queues (public preview) | |
| Copilot Studio | Agents |
We’re excited for you to improve the operational health of your apps, agents and automations in Power Platform. Learn more about Monitor and how to create alerts here.